This will summarise how to take the Oracle provided monitoring templates and modify them with extra metrics specific for your applications.
The Monitoring Template will then be added to a Template Collection and assigned to an Administration Group so that the new monitoring metric collection applies to all targets in that Administration Group.
In this example, monitoring of a log file for a certain string will be added to the Monitoring Template. When the string is detected a certain amount of times a WARNING or CRITICAL incident will be raised by OEM.
The new metric collection setting will be applied to all “SOA Infrastructure” targets in Staging or Production environment.
These steps and screenshots come from OEM 12c Release 4.
In summary, in this post we will:
- Clone an existing Oracle provided monitoring template
- Make changes to the metric collection settings to enable Log File Pattern matching.
- Update the Template Collection to use the custom Monitoring Template in place of the original
- Associate the Template Collection with our desired targets
- Manually force a synchronization to the Targets
- Verify the custom metric collection is applied to the desired Target.
Cloning and Updating a Default Template
Start by logging on to OEM 12 with an account with admin privileges.
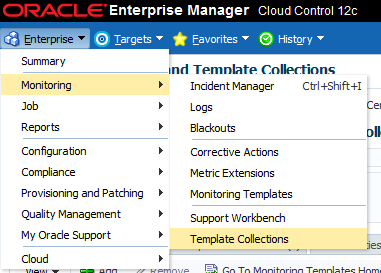
Go to Enterprise -> Monitoring -> Monitoring Templates

Find the Monitoring Template you wish to modify by choosing the Target Type and ensure Display Oracle Certified Templates is selected.
The small icon with two squares and a loopy arrow indicates the one that is applied to new Targets.
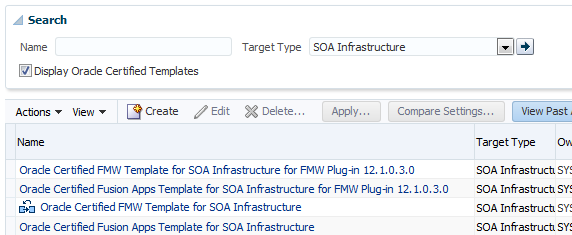
Select the row of the default and then Actions -> Create Like
Specify a meaningful name and if this should become the new default template click the “Default” checkbox.
Now it’s possible to edit the metric collections. Add some log monitoring for the SOA logs.
When editing the templates click the “Metric Thresholds” tab.
Make sure the “All Metrics” value is selected in the View dropdown.

Scroll down to “Log File Monitoring”. By default it’s disabled. Click “Disabled” to enable it.
Next, click the cluster of edit pencils on the Log File Pattern Matched Line Count.

Find the well hidden “Add” button to add new log file patterns to monitor for:
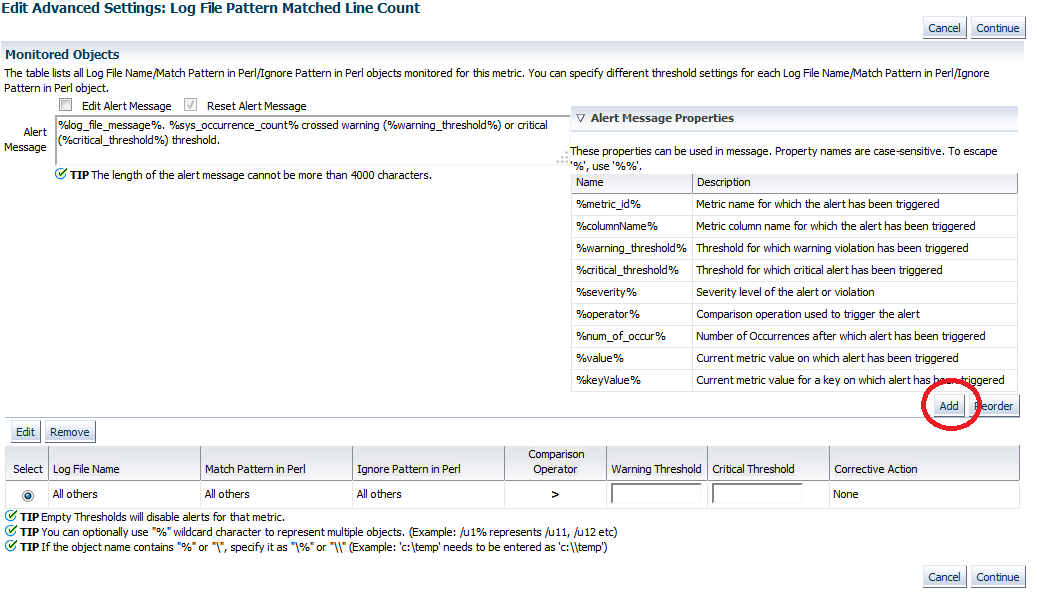
To test the alert a rule is created as follows, using a message known to occur regularly:
Log File Name: /u01/logs/diagnostic.log
Match Pattern In Perl: javax.xml.ws.WebServiceException
Warning Threshold: 10
Critical Threshold: 50
Note: If applying across multiple targets where the log file name might be different per host, create a symbolic link to a generic filename on the OS. For example:
# on UAT SOA1
cd /u01/logs
ln -s /u01/logs/uat_soa1-diagnostic.log diagnostic.log
# on UAT SOA2
cd /u01/logs
ln -s /u01/logs/uat_soa2-diagnostic.log diagnostic.log
The % character can also act as a wildcard so log files with different names (i.e. different environments and nodes) can be checked with a single rule. It might take some experimentation to make the wild card work as expected....
Click “Continue” then “OK”. The rule is saved to the monitoring template.
Note: There seems to be a bug in OEM 12c where (sometimes?) edits to a Monitoring Template do not update the template when later viewing it, but the changes persist when going back to Edit.
Logging out of OEM and back in again seems to refresh the View of the Monitoring Template and shows the changes from Edit.
The changes in the monitoring template will not apply until it is assigned to targets, or it is included in a Template Collection associated with the desired targets.
Optionally, the template can be applied manually to any desired target(s). This is a once off application, and any future changes to the template will need to be applied manually in the same way to all the targets.
The better solution is to add the new template to the template collection already applied to the target groups.
Updating Template Collections with the new Monitoring Template
Visit Enterprise -> Monitoring -> Template Collections
Click the Template Collection that’s applied to your targets and click “edit”.
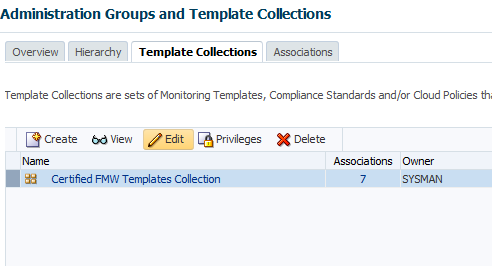
The list of templates in the Template Collection is shown.

If one of the included templates was cloned to create the new, custom template the old one must first be removed from the collection. Select the row and click the Remove button.Then click Add.

Select the new custom created template and click Select.
Click Save.
Synchronise the Template Collection to Targets
The template collection will not be applied to the targets until OEM successfully synchronises. This is done on a schedule which is configured under Setup -> Add Target -> Administration Groups and then click “Synchronization Schedule”.
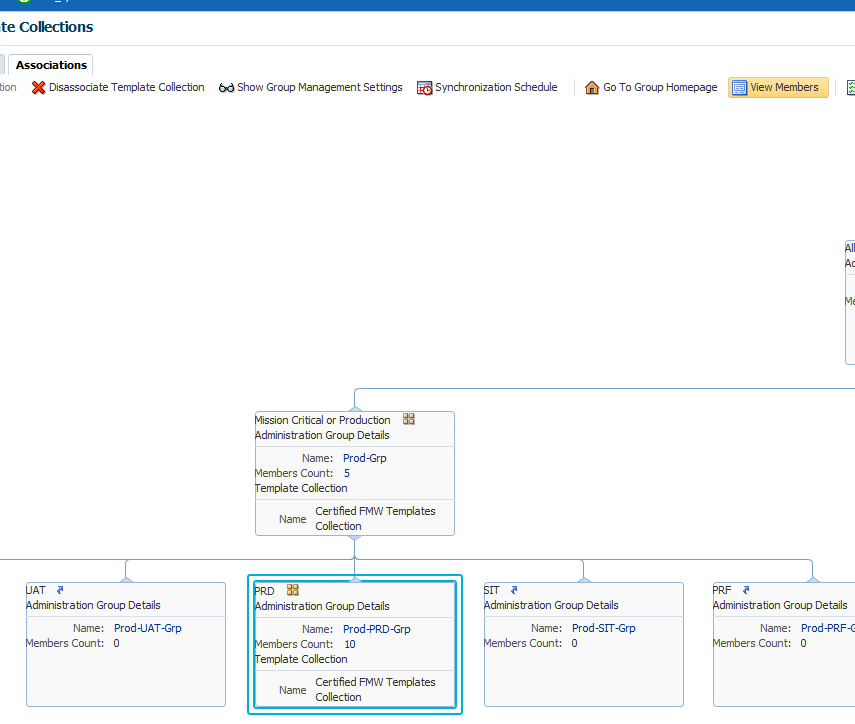
The Target for the monitoring template also needs to be a member of the Administration Group. The targets in the Administration Group are populated automatically based on the properties (Lifecycle Status) of the Target, usually set when adding the target. To check if the targets are included in the Administration Group go to the Associations tab, select the group and click “View Members”. Only “Direct Members” will receive updates to Monitoring Templates affecting that type of Target.
To update it on an existing target visit the Target’s page and then select Target Setup -> Properties
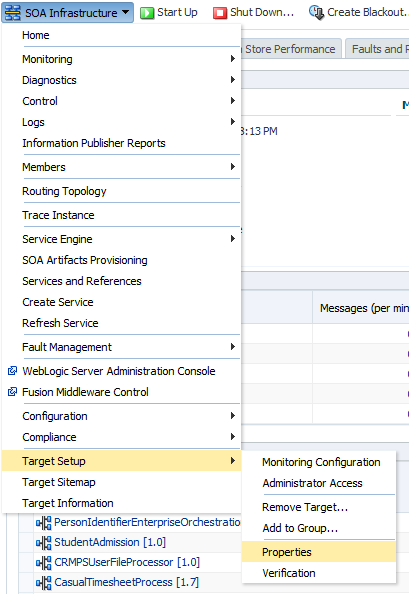
From here click Edit and then the Lifecycle Status can be selected from a drop down of valid values.

To synchronise manually click the group on the Associations page, then press the Go To Group Homepage button:

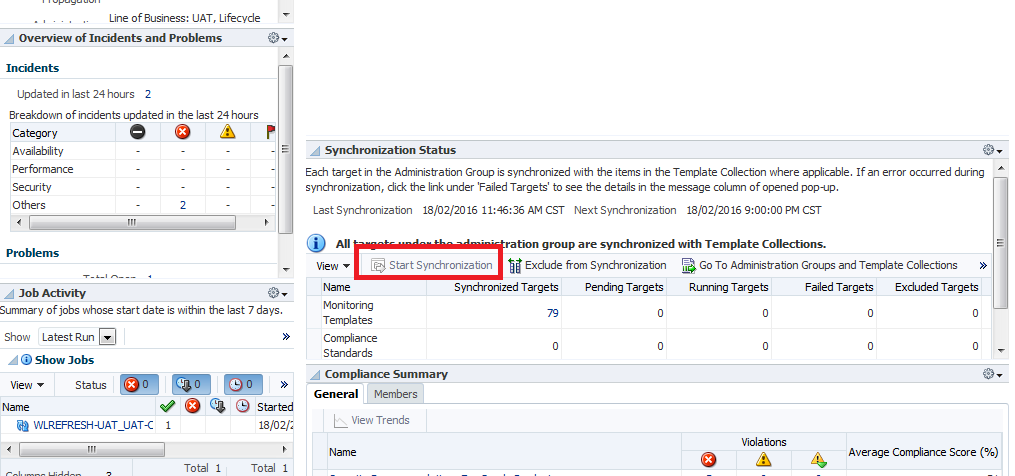
The Start Synchronization button will trigger a manual sync.
Note: If your synchronisation fails and the details of the Failure show as: “Failed because admin group privileges were revoked” it can be worked around by returning to the associations page, de-associating the Template Collection from the Group. Wait a minute, then re-associate it. Then re-sync.
Verification
Once the Sync finishes, confirm the Monitoring Template is Applied to the Targets.
View the Target by browsing EM and then click Monitoring -> Metric and Collection Settings

Now in the Metrics overview the Information at the top warns that the target monitoring metrics are managed by Administration Group Hierarchy and the related Templates. The log file monitoring is shown under “Metrics with Thresholds”.

If the message is already in the logs, and email notifications are configured, the event should be sent almost immediately.
