Showing posts with label OEM. Show all posts

Thursday, 18 February 2016

OEM 12C Modifying a Default Monitoring Template and Adding Log File Monitoring

This will summarise how to take the Oracle provided monitoring templates and modify them with extra metrics specific for your applications.


The Monitoring Template will then be added to a Template Collection and assigned to an Administration Group so that the new monitoring metric collection applies to all targets in that Administration Group.

In this example, monitoring of a log file for a certain string will be added to the Monitoring Template. When the string is detected a certain amount of times a WARNING or CRITICAL incident will be raised by OEM.

The new metric collection setting will be applied to all “SOA Infrastructure” targets in Staging or Production environment.

These steps and screenshots come from OEM 12c Release 4.

In summary, in this post we will:
  1. Clone an existing Oracle provided monitoring template
  2. Make changes to the metric collection settings to enable Log File Pattern matching.
  3. Update the Template Collection to use the custom Monitoring Template in place of the original
  4. Associate the Template Collection with our desired targets
  5. Manually force a synchronization to the Targets
  6. Verify the custom metric collection is applied to the desired Target.

Cloning and Updating a Default Template


Start by logging on to OEM 12 with an account with admin privileges.

Go to Enterprise -> Monitoring -> Monitoring Templates


Find the Monitoring Template you wish to modify by choosing the Target Type and ensure Display Oracle Certified Templates is selected.
The small icon with two squares and a loopy arrow indicates the one that is applied to new Targets.
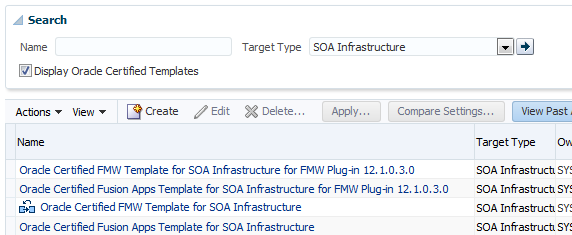

Select the row of the default and then Actions -> Create Like

Specify a meaningful name and if this should become the new default template click the “Default” checkbox.

Now it’s possible to edit the metric collections. Add some log monitoring for the SOA logs.

When editing the templates click the “Metric Thresholds” tab.

Make sure the “All Metrics” value is selected in the View dropdown.
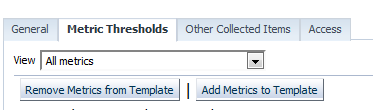

Scroll down to “Log File Monitoring”. By default it’s disabled. Click “Disabled” to enable it.

Next, click the cluster of edit pencils on the Log File Pattern Matched Line Count.


Find the well hidden “Add” button to add new log file patterns to monitor for:
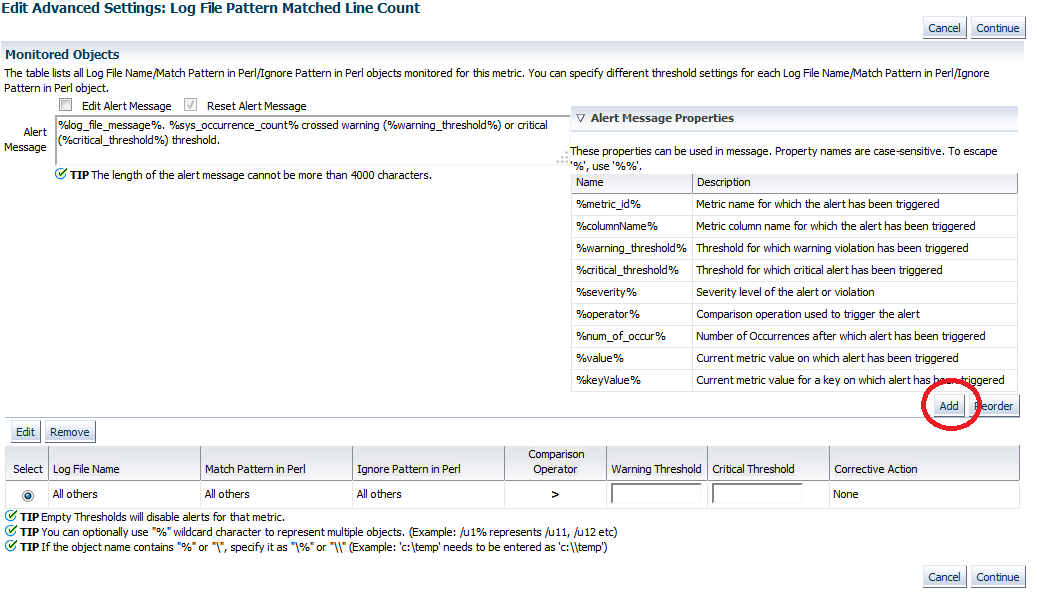

To test the alert a rule is created as follows, using a message known to occur regularly:

Log File Name: /u01/logs/diagnostic.log
Match Pattern In Perl: javax.xml.ws.WebServiceException
Warning Threshold: 10
Critical Threshold: 50

Note: If applying across multiple targets where the log file name might be different per host, create a symbolic link to a generic filename on the OS. For example:

# on UAT SOA1
cd /u01/logs
ln -s /u01/logs/uat_soa1-diagnostic.log diagnostic.log

# on UAT SOA2
cd /u01/logs
ln -s /u01/logs/uat_soa2-diagnostic.log diagnostic.log


The % character can also act as a wildcard so log files with different names (i.e. different environments and nodes) can be checked with a single rule. It might take some experimentation to make the wild card work as expected....

Click “Continue” then “OK”. The rule is saved to the monitoring template.

Note: There seems to be a bug in OEM 12c where (sometimes?) edits to a Monitoring Template  do not update the template when later viewing it, but the changes persist when going back to Edit.
Logging out of OEM and back in again seems to refresh the View of the Monitoring Template and shows the changes from Edit.

The changes in the monitoring template will not apply until it is assigned to targets, or it is included in a Template Collection associated with the desired targets.

Optionally, the template can be applied manually to any desired target(s). This is a once off application, and any future changes to the template will need to be applied manually in the same way to all the targets.

The better solution is to add the new template to the template collection already applied to the target groups.

Updating Template Collections with the new Monitoring Template

Visit Enterprise -> Monitoring -> Template Collections
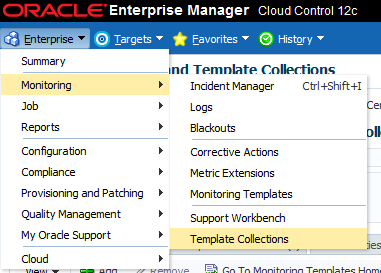
Click the Template Collection that’s applied to your targets and click “edit”.
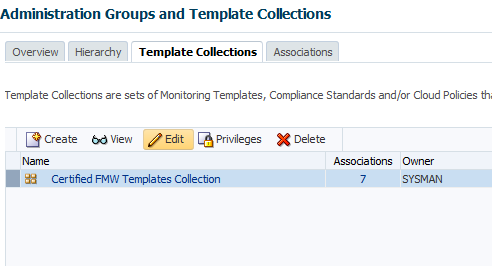
The list of templates in the Template Collection is shown.


If one of the included templates was cloned to create the new, custom template the old one must first be removed from the collection. Select the row and click the Remove button.Then click Add.

Select the new custom created template and click Select.
Click Save.


Synchronise the Template Collection to Targets


The template collection will not be applied to the targets until OEM successfully synchronises. This is done on a schedule which is configured under Setup -> Add Target -> Administration Groups  and then click “Synchronization Schedule”.

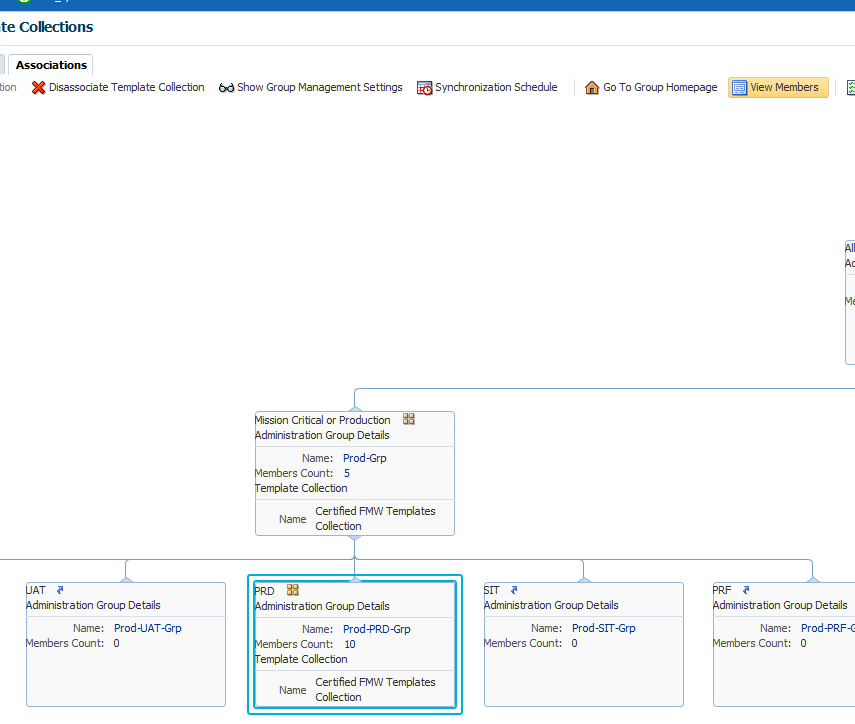
The Target for the monitoring template also needs to be a member of the Administration Group. The targets in the Administration Group are populated automatically based on the properties (Lifecycle Status) of the Target, usually set when adding the target. To check if the targets are included in the Administration Group go to the Associations tab, select the group and click “View Members”. Only “Direct Members” will receive updates to Monitoring Templates affecting that type of Target.

To update it on an existing target visit the Target’s page and then select Target Setup -> Properties
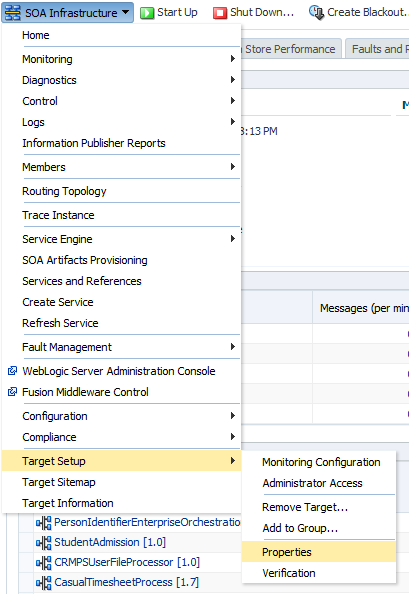

From here click Edit and then the Lifecycle Status can be selected from a drop down of valid values.

To synchronise manually click the group on the Associations page, then press the Go To Group Homepage button:


The Start Synchronization button will trigger a manual sync.
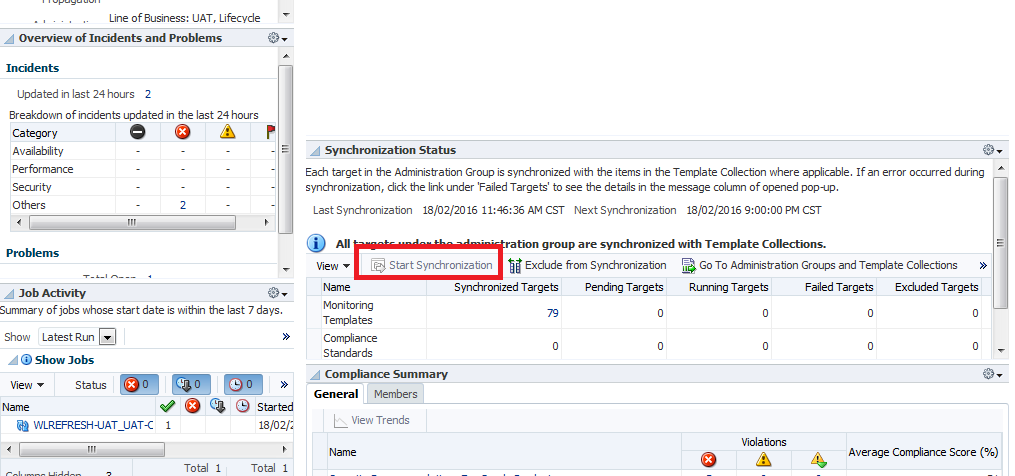
Note: If your synchronisation fails and the details of the Failure show as: “Failed because admin group privileges were revoked” it can be worked around by returning to the associations page, de-associating the Template Collection from the Group. Wait a minute, then re-associate it. Then re-sync.

Verification

Once the Sync finishes, confirm the Monitoring Template is Applied to the Targets.

View the Target by browsing EM and then click Monitoring -> Metric and Collection Settings


Now in the Metrics overview the Information at the top warns that the target monitoring metrics are managed by Administration Group Hierarchy and the related Templates. The log file monitoring is shown under “Metrics with Thresholds”.


If the message is already in the logs, and email notifications are configured, the event should be sent almost immediately.


Monday, 9 November 2015

Investigating SOA SCA Composite Faults without Enterprise Manager (EM)

If you're ever facing a problem with SOA instances faulting, and at the same time you're having problems running or accessing Oracle Enterprise Manager for SOA Suite, you can directly access the Composite faults via the SOAINFRA Database.

The name of the table containing the faults is:
COMPOSITE_INSTANCE_FAULT

A demonstration of SQL to generate a summary of the latest faults is:

select CPST_PARTITION_DATE, ID, COMPOSITE_DN, SERVICE_NAME, ERROR_MESSAGE, STACK_TRACE
from MYPREFIX_SOAINFRA.COMPOSITE_INSTANCE_FAULT
order by created_time desc;

The ERROR_MESSAGE and STACK_TRACE fields will provide the same error message details that are usually visible in Enterprise Manager.

Thursday, 16 July 2015

Automatically Generating a Weblogic Thread Dump during High CPU (using JRockit)

One of the best ways to gain insight into why a Weblogic Server instance consumes maximum system CPU is to take a thread-dump of the JVM when the high CPU incident occurs.

The Weblogic Admin Console allows you to create a thread-dump via GUI under the Server view, however sometimes this isn't a good solution because:

  1. The high CPU incident occurs when you do not have access to the Admin Console
  2. The high CPU incident locks up your Admin Console, which can occur when the Admin Console is hosted on the same host as the JVM with high CPU, or if there is a lot of network traffic between the faulty Weblogic JVM and the Webserver causing your Admin Console to perform poorly.
A better solution is to automatically dump the threads via the system shell. The following instructions are for JRockit (and Linux) and utilise some JRockit utils. If you are using Java SE you will find a good guide to creating a similar script here at the middlewaremagic.com blog.

highcpu.sh
WL_PID=`ps -ef | grep weblogic.Name=my_server1 | grep -v grep | awk '{print $2}'`
DATESTAMP=`date "+%m%d_%I%M"`
jrcmd $WL_PID print_threads > /var/logs/oracle/${DATESTAMP}-threaddump.log
top -H -b -n 1 -p $WL_PID > /var/logs/oracle/${DATESTAMP}-threadids.log

The script explained:
  1. find the PID of the Weblogic Server process. I assume you will know which server is encountering high CPU problems, and can substitute it for the "my_server1" value. If not you can grep from the 'top' command and find the java process with the highest CPU.
  2. Creates a timestamp for our log file in a preferred format
  3. Executes the JRockit tool jrcmd, passes it the Weblogic Server PID and dumps out the threads to the TIMESTAMP-threaddump.log
  4. Executes top for the Weblogic Server PID and dumps all the ID in descending order of CPU consumption.
With these two log files you can now examine which threads are causing the high CPU consumption. Find the Thread ID (called pid) in the threadids.log and then find the corresponding "tid" in threaddump.log. Hopefully from this you can learn which thread activity and code is causing your high CPU usage.

Now, in order to have this to run automatically when the high CPU occurs there are many options. With just Linux you can monitor top with a cron job which runs the dump when CPU is detected to be over a certain threshold. Or if you have a monitoring tool you should be able to configure an alert that runs the script. In my case I can configure Oracle Enterprise Manager to execute the script as a "corrective action" when it detects CPU Utilization on the host reaches a defined threshold.


Thursday, 4 June 2015

Understanding Host Memory Utilization Monitoring and Alerts for Java Based Middleware

Have you received an alert like this?

EM Event: Warning:Memory Utilization is 85.004%, crossed warning (85) or critical (90) threshold.


[ALERT] priority of [Medium] for alert [Memory Utilization above 80%] on resource


You’ve probably decided to set up Oracle Enterprise Manager (OEM) or JBoss Operations Network (JON) monitoring for the Linux host machine running your Oracle Middleware/Database software or JBoss middleware.

After some time running this alert about the host’s Memory Utilization begins to occur. You check OEM or JON consoles and even more disturbingly this is an upward trend that has been happening since the software started running.


No problems are occurring within the applications or database itself, so what should be done?


TL;DR
Linux’s memory management by design will always try to use free RAM for caching. If memory requirements increase these buffers will be released immediately. No action should be taken and the alert should be tuned for either a much higher threshold (98%) or disabled. See the final section of this post for what metrics you should monitor to manage the health of your platform’s memory.


The Long Explanation
If you still need reassurance that the alert is nothing to worry about we can go through the process of checking ourselves to make sure everything is healthy.


How does Oracle EM Agent determine Memory Utilization on a Linux Host?
The answer to this question is found in the following Oracle Support doc:


To summarise, OEM will calculate the memory capacity by comparing MemTotal and MemFree in /proc/meminfo


[oracle@prd-soa1 ~]$ grep Mem /proc/meminfo
MemTotal:       68042432 kB
MemFree:         4403660 kB


(4403660 / 68042432) * 100 = Free Memory Percentage. (Currently about 6%)


JBoss ON probably uses a similar method for calculating the memory utilization.


How does Linux Manage Memory Utilization?
Using the free command we can see the Linux memory state (pass the -m flag for megabytes, default is kilobytes).


[oracle@prd-soa1 prd-ofm-domain]$ free -m
            total       used       free     shared    buffers     cached
Mem:         66447      62159       4288          0        572      25056
-/+ buffers/cache:      36530      29917
Swap:         1023          0       1023


The second row of output, preceded by “-/+ buffers/cache” represents the true state of the Linux memory when the RAM level caching isn’t counted. In this example we can see that the actual available memory is 30GB, despite the first row showing that only 4GB of the 64GB is free.


We can also see our swap used is 0. This is a good sign of a healthy system. Linux will utilise the swap space when it cannot fit objects into the RAM.


Check Memory Health Using vmstat
The inbuilt vmstat command can provide us with some more helpful diagnostics of the state of the Linux memory system. Here I pass two arguments, the first is the wait between checks and the second is the number of checks. The vmstat process will check ten times over ten seconds. You can adjust these as needed. Finally the output is piped to column to help with formatting and readability.


[oracle@prd-soa prd-ofm-domain]$ vmstat 1 10 | column -t
prcs
-----------memory----------
-swap-
--io--
--system--
-----cpu-----
r
b
swpd
free
buff
cache
si
so
bi
bo
in
cs
us
sy
id
wa
st
5
0
0
4403052
585904
25646240
0
0
1
11
2
0
6
1
93
0
0
3
0
0
4403160
585904
25646240
0
0
0
32
7441
4705
44
3
53
0
0
2
0
0
4403032
585904
25646280
0
0
0
448
7226
4555
41
2
57
0
0
1
0
0
4403032
585904
25646352
0
0
0
144
1993
644
23
0
77
0
0
2
0
0
4403024
585904
25646352
0
0
0
12
8188
4682
47
4
50
0
0
2
0
0
4402972
585908
25646408
0
0
0
792
7094
5075
37
2
61
0
0
3
0
0
4402540
585908
25646916
0
0
0
0
7954
4909
45
3
52
0
0
2
0
0
4402416
585908
25647008
0
0
0
128
6852
5058
40
2
58
0
0
2
0
0
4402208
585908
25647436
0
0
0
2
7934
5010
41
3
56
0
0
1
0
0
4402208
585908
25647564
0
0
0
0
1527
491
20
0
80
0
0

There are many excellent articles online about how to interpret this data. In our case we are mainly interested in checking for activity in the Swap In (si) and Swap Out (so) columns. Entries in the Swap Out column indicate that the operating system is swapping memory from RAM to disk when it doesn’t have the capacity to store everything in RAM.


In our example above we see no activity in the swap columns, so we can feel confident that memory utilisation is healthy.
Of course, running the vmstat logging over a longer period of time while consecutively loading your system will give the best indication of how swap is being used. However, why should we do that manually?


What Monitoring You Should Have For Linux Hosts Running Java Based Middleware
Because Oracle Weblogic and JBoss Fuse components all run in Java Virtual Machines we actually have total control of how much RAM our platform’s components will consume. It’s set by the Java arguments. So long as we do not set the combined total of our Xmx (Memory Max) arguments for all JVMs on the box (and allow some space for non-java processes to use RAM) we should never exceed the memory due to our JVMs.


Note: Of course it's possible to set Xms (Memory Min) to a value less than the Xmx, which would permit you to exceed the total memory of the system in your combined total of Xmx, and not realise the problem until each JVM tries to consume the Xmx value. It is best practice, however, to set the Xms and Xmx values to be the same. This improves performance and garbage collection and has the handy side-effect of preventing us from running too many JVMs.


By setting the Xmx value it means that if we do try start a Java process and the operating system memory (minus buffers) is not sufficient the JVM will fail to start.


Monitoring Correctly For Memory Usage
Use the following monitoring configurations to more accurately keep an eye on your hosts memory health:

Availability of JVM Processes - because if there’s not enough memory to start or run a process, the availability alert will let us know.


OS Swap Space Usage - because if the operating system is starting to consume swap space then we want to know, as that is a sign that there is no actual free RAM to use.

Middleware Process JVM Usage - because we can keep track of how high the JVM Heap usage is. If heap utilisation is consistently very low and we experience alerts for the other two alerts above it might be rational to decrease the size of the JVM to correct the problem.